Lattices and Graphs
The previous HOWTOs showed how to describe an arbitrary graph directly, and how to describe a lattice’s geometry through a unit cell and its basis vectors. Here we combine the two: decorating each copy of a lattice’s unit cell with a small graph to build the actual graph that gets simulated.
A simple graph
The graphs in most physics simulations are not irregular, but are built up regularly, like a lattice:

We can capture the regularity of this graph by placing it on a lattice:
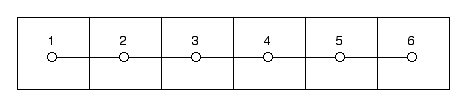
This lattice can be described by a unit cell, with the full graph built up by decorating every copy of that unit cell with the same “unit cell graph”:
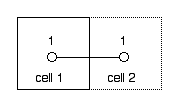
The unit cell graph here consists of a single vertex, with an edge to the same vertex in the neighboring cell. We can describe such a graph on a lattice in XML by combining a <LATTICE> or <FINITELATTICE> with a <UNITCELL> element describing the graph on the unit cell from which the full graph is created:
<LATTICEGRAPH>
    <FINITELATTICE>
    <LATTICE dimension="1"/>
        <EXTENT size="6"/>
        <BOUNDARY type="open"/>
    </FINITELATTICE>
    <UNITCELL dimension="1" vertices="1">
    <VERTEX/>
    <EDGE>
        <SOURCE vertex="1"/>
        <TARGET vertex="1" offset="1"/>
    </EDGE>
    </UNITCELL>
</LATTICEGRAPH>
The edge in the unit cell goes from vertex 1 in the cell to vertex 1 in the cell to the right (with an offset of +1), as described in the <EDGE> element. The offset of 0 for the <SOURCE> element was omitted, since 0 is its default value.
To describe an infinite chain, we would use a <LATTICE> element instead of the <FINITELATTICE> one.
A complex example
We can again describe graphs with colored edges and vertices, or add other attributes like coordinates to the vertices. Also, the lattice part of a <LATTICEGRAPH> can use the full machinery described in Lattice and Unit Cells, including finite extents, boundary conditions, and referencing a previously defined lattice. We will show one example for a complex periodic graph on an L x W rectangular lattice:
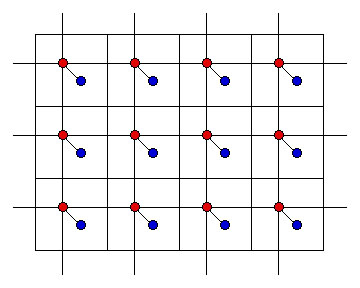
This graph on a lattice can be built from this complex unit cell graph decorating the rectangular lattice:
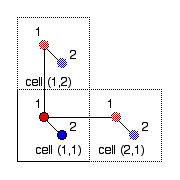
The XML description is:
<LATTICE name="square" dimension="2">
    <BASIS>
    <VECTOR> 1 0 </VECTOR>
    <VECTOR> 0 1 </VECTOR>
    </BASIS>
</LATTICE>
<FINITELATTICE name="rectangular periodic" dimension="2">
    <LATTICE ref="square"/>
    <PARAMETER name="L"/>
    <PARAMETER name="W" default="L"/>
    <EXTENT dimension="1" size="L"/>
    <EXTENT dimension="2" size="W"/>
    <BOUNDARY type="periodic"/>
</FINITELATTICE>
<UNITCELL name="complex example" dimension="2" vertices="2">
    <VERTEX id="1" type="0"><COORDINATE> 0.3 0.7 </COORDINATE></VERTEX>
    <VERTEX id="2" type="1"><COORDINATE> 0.6 0.3 </COORDINATE></VERTEX>
    <EDGE><SOURCE vertex="1"/><TARGET vertex="1" offset="1 0"/></EDGE>
    <EDGE><SOURCE vertex="1"/><TARGET vertex="1" offset="0 1"/></EDGE>
    <EDGE><SOURCE vertex="1"/><TARGET vertex="2"/></EDGE>
</UNITCELL>
<LATTICEGRAPH>
    <FINITELATTICE ref="rectangular periodic"/>
    <UNITCELL ref="complex example"/>
</LATTICEGRAPH>
Here we made use of previously defined, named lattices and unit cells (e.g. from a library), which we can then combine by referencing them in the <LATTICEGRAPH> element. Alternatively, we could have defined everything in the <LATTICEGRAPH> element:
<LATTICEGRAPH>
    <FINITELATTICE dimension="2">
    <LATTICE dimension="2">
        <BASIS>
        <VECTOR> 1 0 </VECTOR>
        <VECTOR> 0 1 </VECTOR>
        </BASIS>
    </LATTICE>
    <PARAMETER name="L"/>
    <PARAMETER name="W" default="L"/>
    <EXTENT dimension="1" size="L"/>
    <EXTENT dimension="2" size="W"/>
    <BOUNDARY type="periodic"/>
    </FINITELATTICE>
    <UNITCELL dimension="2" vertices="2">
    <VERTEX id="1" type="0"><COORDINATE> 0.3 0.7 </COORDINATE></VERTEX>
    <VERTEX id="2" type="1"><COORDINATE> 0.6 0.3 </COORDINATE></VERTEX>
    <EDGE><SOURCE vertex="1"/><TARGET vertex="1" offset="1 0"/></EDGE>
    <EDGE><SOURCE vertex="1"/><TARGET vertex="1" offset="0 1"/></EDGE>
    <EDGE><SOURCE vertex="1"/><TARGET vertex="2"/></EDGE>
    </UNITCELL>
</LATTICEGRAPH>
Since both the vertex coordinates in the unit cell and the basis vectors of the lattice are given, the coordinates of all vertices can be calculated.
For an overview of the rest of this section, see Lattice Definitions. For the LATTICE/GRAPH input parameters used to select a graph in a simulation, see Common Parameters. For the other ALPS documentation sections, see the General Introduction.